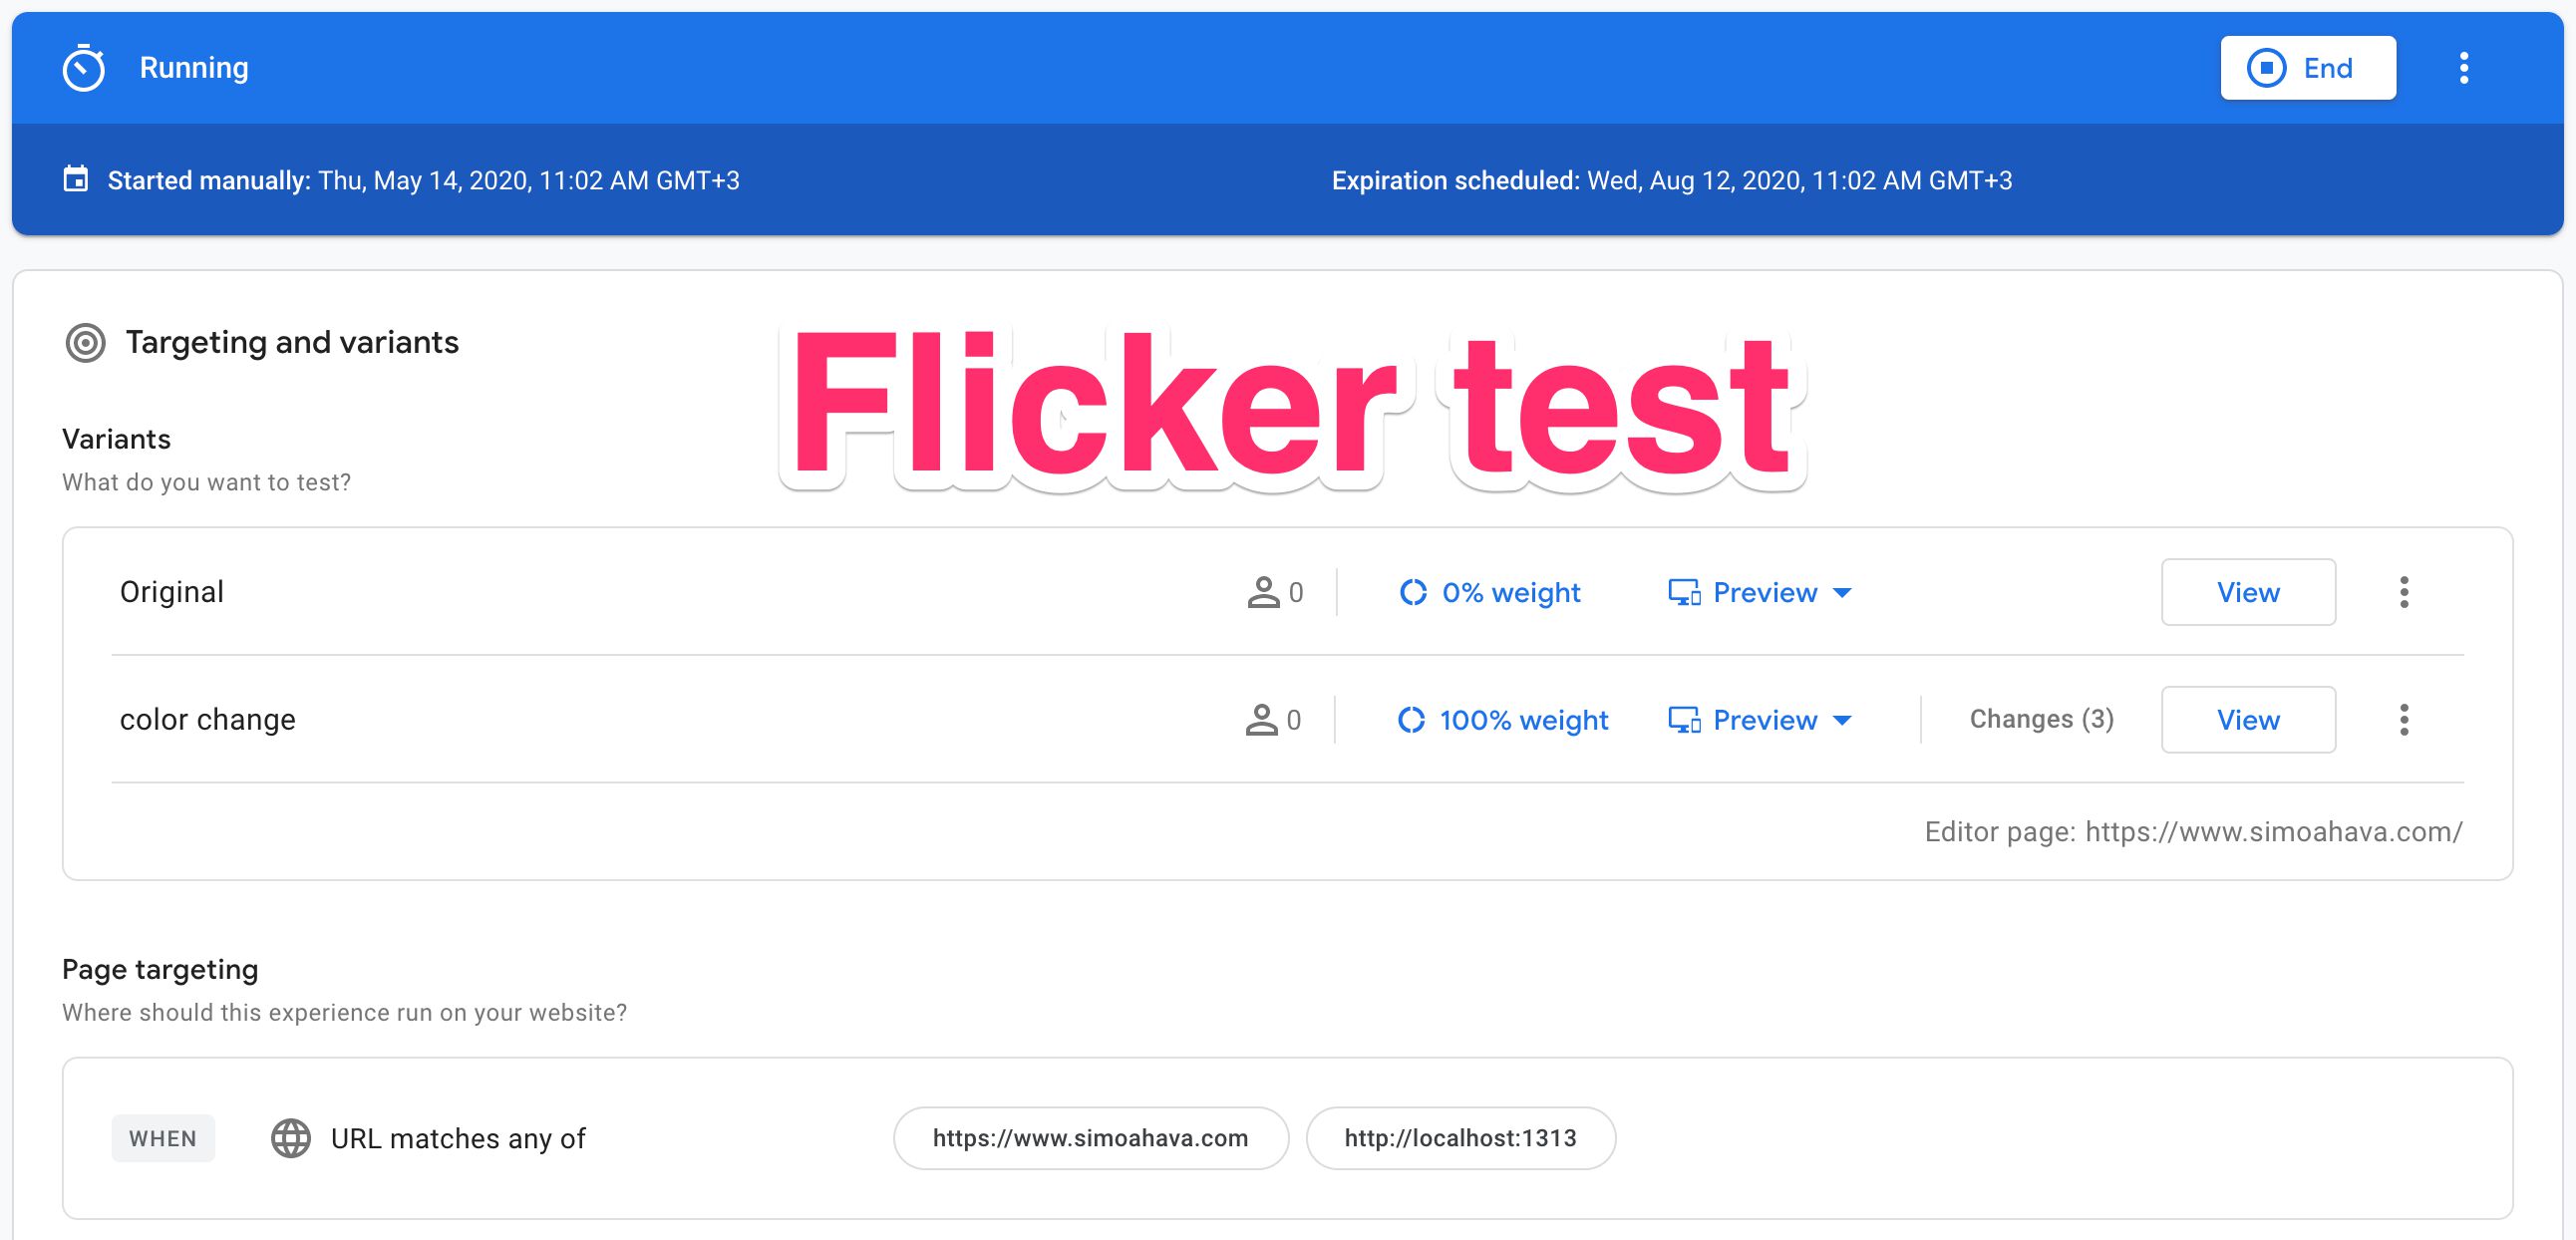
Recently I published an article on how to set up an impact test for the “flicker effect” omnipresent in client-side A/B-testing tools. Be sure to check out that article first to get some context to what we’re going to be talking about here.
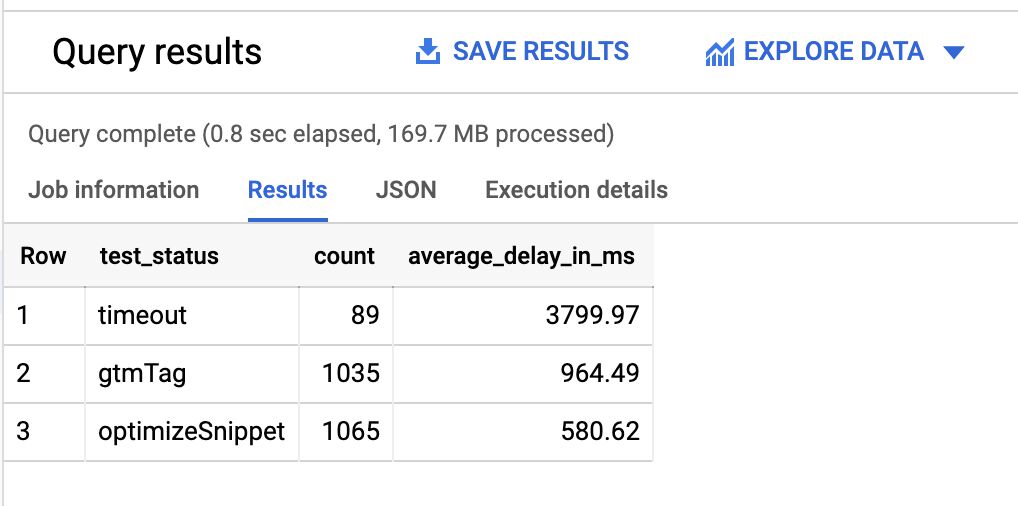
In this short follow-up, I’ll show you how to measure the average time of the anti-flicker snippet delaying page visibility, if you choose to deploy the snippet.
“Flickering” or “Flash Of Original Content” (FOOC) is a phenomenon where there’s a (typically) slight but observable delay in the browser updating the site or element layout if the user is included in a variant group for experimentation. This manifests in the original, unmodified element being rendered in the visible portion of the page before the experiment library updates it with the variant.
There are ways to mitigate the flicker:
I really like Google Optimize. It has a fairly intuitive UI, setting up experiments is easy, and there’s integrations for both Google Tag Manager and Google Analytics built into the system. It’s still a JavaScript-based, client-side A/B-testing tool, so problems with flicker and asynchronous loading are ever-present (though this is somewhat mitigated by the page-hiding snippet).
One issue with the Google Analytics integration is the difficulty of creating segments for sessions where the users were actively participating in the experiment.