One of the glaring omissions in the Enhanced Ecommerce reports of Universal Analytics is the ability to calculate cart value for products. Cart value, here, is the value that has been added to the cart.
This value can be used to query for products that have the highest discrepancy between cart value and generated revenue. These are missed opportunities of the highest caliber.
With some Custom Metrics magic, we can, however, get cart value into our reports, and we can find our most and least “effective” products with just a glance:
According to their website, SoundCloud is “the world’s leading social sound platform where anyone can create sounds and share them everywhere”. For artists, it’s a channel for distributing previews of their tracks, and for people like me it’s a nice way to do some API tinkering. To each their own, I guess!
I saw a number of requests in the Google+ Google Tag Manager community about a SoundCloud integration, so I decided to look into it to see if I could just build one.
Data is difficult. Growing a business is difficult. Measuring success is difficult. And you know what? They should be difficult. Otherwise we’d all be equally stupid, whereas now those of us ambitious enough to exert themselves are winning the race.
And it’s not just working with data that’s difficult. The whole Web is a mess! Search engine optimization consultants, for example, are trigger-happy in doling out advice about server-side redirects without stopping to consider the implications of what they’re recommending.
Last weekend, I wrote a very simple web app that automatically creates a number of referral spam filters to tackle the problem that seems to have everybody all riled up.
For a nice recap of the situation, take a look at this post by Jeff Sauer, or this article by Mike Sullivan.
This isn’t an opinion piece, even though I’ve got a great number of opinions about this issue.
A schema is something that data processing platforms such as Google Analytics apply to the raw hit data coming in from the data source (usually a website). The most visible aspect of Google Analytics’ schema is how it groups, or stitches, the arbitrary, hit-level data coming in from the website into discrete sessions, and these are actually grouped under yet another aggregate bucket: users.
But you already know this. You’re looking at metrics like Sessions, Bounce Rate, Conversion Rate, and you’re using them or variations of them as KPIs in your dashboards and whatnot.
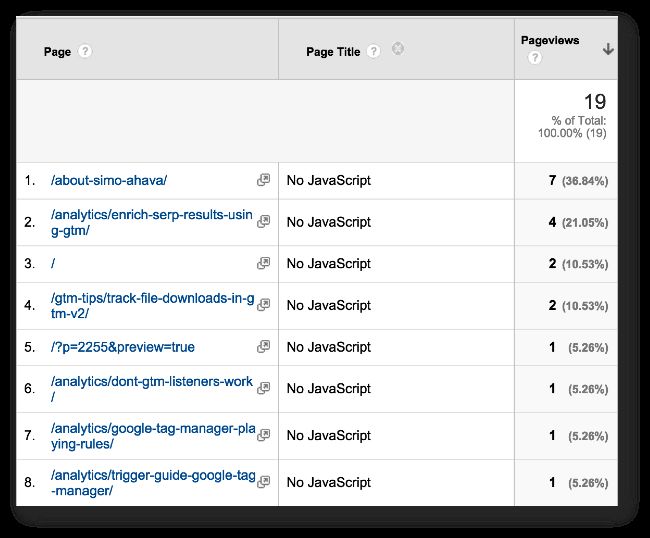
One of the big mysteries in browser-based data collection platforms like Google Analytics is what happens when the visitor is not being tracked. This is most obvious in cases where the user explicitly opts out of tracking, when the user does not have JavaScript active in their browser, in bounced sessions, and on exit pages.
Opt-outing means that the user explicitly prohibits a website from tracking them. In some cases, it’s possible that opt-out is the default, and the user must explicitly opt-in to allow GA to record their visits.
If you use Google Analytics, Google Tag Manager, or any JavaScript-based data collection or analytics platform, have you ever stopped to wonder how they actually work? I mean, you obviously care about getting the data in, but are you taking the machinations of these tools for granted?
This is something I’ve been thinking about for a long while, because I’m not so sure that many who work with these platforms actually understand how the browser and the web page interact.