Over the last couple of posts I’ve mainly been doing proof-of-concept (POC) tests with Google Tag Manager. The great thing about a POC is that you don’t really need to have any viable results or insight-driving technological innovations. The point is to showcase some feature of the platform on which the experiment was conducted.
In this post, I’ll take a care-free step into the world of POCs again. My goal is to do a simple split test in order to identify which variant of a landing page (or key element thereof) produces the most conversions.
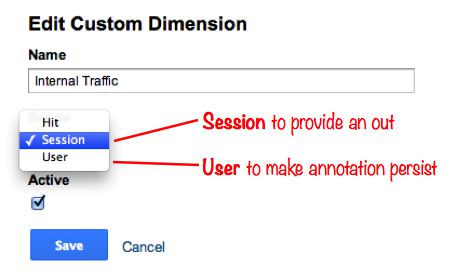
You’ve probably come across a number of guides or posts talking about why it’s necessary to block so-called internal traffic from your web analytics reports. The reasons are pretty solid: internal traffic does not emulate normal visitor behavior, it rarely contributes to conversions (skewing up your conversion rate), it inflates page views, and it wreaks havoc on your granular, page-by-page data.
Internal traffic is vaguely described as “your employees”, “people really close to your brand”, “your marketing department”, “your web editors”, and so on.
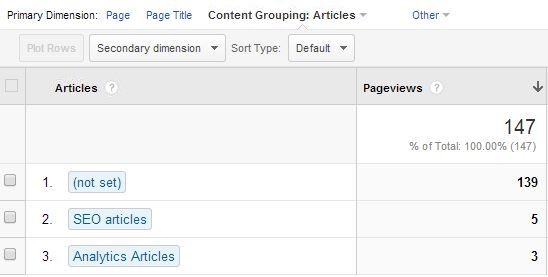
Content Grouping is a nice new feature from the good folks at Google Analytics. Basically, it allows you to group your content according to a logical structure. You can create up to five Content Groupings, and you can have as many Content Groups within these groupings as you like. The difference between a Content Grouping and Content Group is hierarchy. The second is a member of the first. Read Justin Cutroni’s post on Content Groupings to get you started.
(Last updated June 2014) Google Analytics provides us with a nifty way of tracking social interactions. With a simple plugin, you can track how many +1s and Likes your pages accumulate.
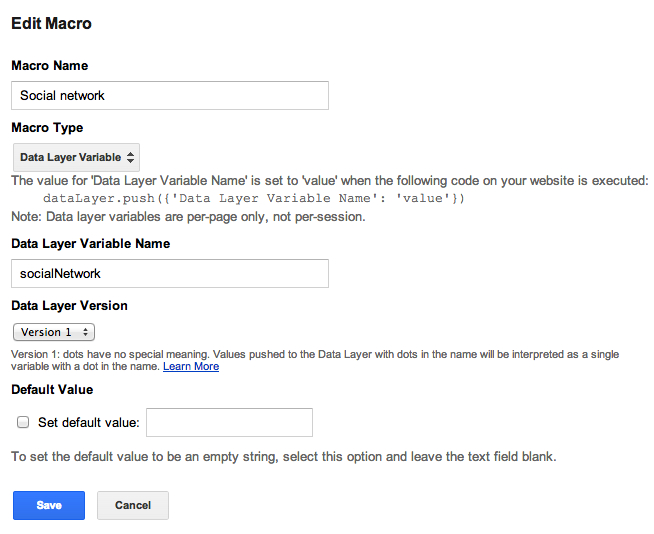
This guide shows you how to activate social interaction tagging with Google Tag Manager and Universal Analytics. The instructions are for Facebook Likes, Google+ +1s (now deprecated since Google Analytics tracks +1s automatically), Twitter Tweets and Pinterest Pins.
Note that if you use a third-party API (e.
So here we are again. Universal Analytics and Google Tag Manager, the dynamic duo, ready to strike again.
First, remember to check my previous two tips for UA and GTM use in custom scenarios:
Weather as a custom dimension Tracking page load time In this post, I visit the idea of adjusted bounce rate, which I came across a year ago in the Google Analytics blog.
Adjusted bounce rate basically refers to tweaking the traditional bounce rate collection method (single engagement hits / total visits) so that visits which only included a single page view would not count towards a bounce, as long as they met some qualitative requirements.
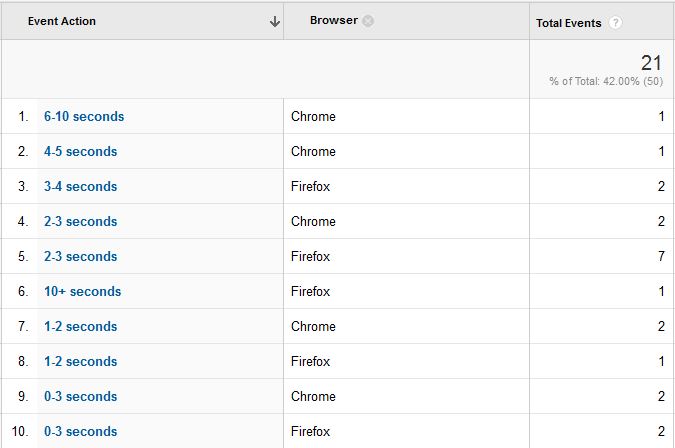
In Google Analytics, you can monitor your site speed and get a decent overview of what pages are contributing positively and negatively to site speed. The problem with page load time metric is that it’s an average based on a sample. You can modify the sample rate with setSiteSpeedSampleRate(), but for me that’s not bloody well good enough.
(UPDATE 28.3.2014: This post is still valid, but an implementation with User Timings is a much smarter way to measure actual page load time.
There is a new version of this post for GTM V2 here.
[Last updated June 2014] I’ve fallen in love with Universal Analytics and Google Tag Manager. Together they form an incredibly powerful tool for marketing professionals. In most cases, I no longer need to post recommendations to my client for yet another page template revision, since with the tag manager in place, I can just add custom code via the admin panel.