You are here: Categories / Analytics
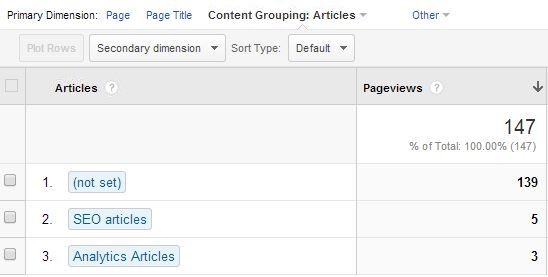
Content Grouping is a nice new feature from the good folks at Google Analytics. Basically, it allows you to group your content according to a logical structure. You can create up to five Content Groupings, and you can have as many Content Groups within these groupings as you like. The difference between a Content Grouping and Content Group is hierarchy. The second is a member of the first. Read Justin Cutroni’s post on Content Groupings to get you started.

Continue reading

Have you ever stopped to think about what the chain of events was that led you to a particular decision? Maybe not, but in web analytics it is something that should be considered. After all, there is something counter-intuitive about analytics tools such as Google Analytics, which require us to think in terms of clicks and recorded events that occur on the website, during the visit. Thankfully, we have evolved as a species, and we no longer place too much emphasis on last click attribution.

Continue reading

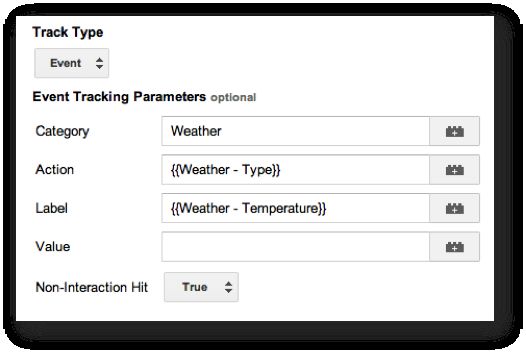
(Last updated March 2014) This post is the final chapter of a trilogy. The ultimate refinement, if you will. It all started with my foray into the murky waters of context, when I tested how weather data could be used to provide extra information about site visits. When I wrote that post, I had two trepidations: 1) does sending the API call with every single page view affect site performance negatively, and 2) does forcing the page view call to wait for the API call to complete affect the quality of visit metrics.

Continue reading

There is a new version of this post for GTM V2 here. While going over my previous post about using weather conditions to segment data in Google Analytics, I started thinking about performance issues. Since I’m using a visit-scope custom dimension, it seems futile to have it send the weather details with every single page load. The odds of the weather changing drastically during one visit are slim (unless you live in the UK), and I have yet to come up with a good reason to change my on-site behavior because the weather changed from a drizzle to a downpour.

Continue reading

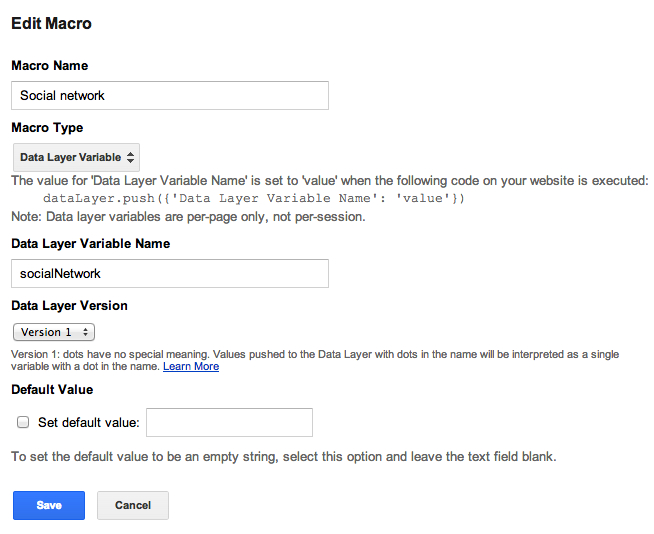
(Last updated June 2014) Google Analytics provides us with a nifty way of tracking social interactions. With a simple plugin, you can track how many +1s and Likes your pages accumulate. This guide shows you how to activate social interaction tagging with Google Tag Manager and Universal Analytics. The instructions are for Facebook Likes, Google+ +1s (now deprecated since Google Analytics tracks +1s automatically), Twitter Tweets and Pinterest Pins. Note that if you use a third-party API (e.

Continue reading

UPDATE 9 Oct 2013 - This works in Google Spreadsheets now as well! Feel free to make a copy of the sheet and work with the code. It’s still just a prototype, but I’m happy to see data bouncing from spreadsheets to Google Analytics. View the Google Spreadsheet here ORIGINAL POST Inspired by Daniel Waisberg’s excellent post detailing the use of Google Web Forms to send data to your Analytics account, I decided to create something similar.

Continue reading

I’ve had such a blast in the Google+ Google Analytics community. Not only are the people super-duper-nice, but I have the wonderful opportunity of helping people with their Google Analytics problems without feeling obligated to invoice them or ask for compensation for my troubles. I do it because I love to help, because I feel like I have a lot to share with the community, and because I’ve always believed that the more knowledge you share the more you accumulate.

Continue reading

Author's picture

Simo Ahava

Husband | Father | Analytics developer
simo (at) simoahava.com

Senior Data Advocate at Reaktor

Finland